
74_5.0L_Z
-
Posts
1194 -
Joined
-
Last visited
-
Days Won
30
Content Type
Profiles
Forums
Blogs
Events
Gallery
Downloads
Store
Everything posted by 74_5.0L_Z
-
That water pump has the same pilot diameter as the stock 5.0L. Therefore you should have no problem in that area.
-
It looks like that water pump will work quite well. It is designed for forward rotation and serpentine pulleys. Go to bed.
-
The 302 is a 5.0L. Until 1982 all of the 302/5.0L were v belt forward rotation. After 1982 Ford and most other manufacturers went to the serpentine system. The post 1982 water pumps rotate counter-clockwise(opposite direction of the crank). The earlier 302 rotated clockwise (same direction as the crank). If you get the water pump from fordracingparts/summit you will be able to keep your current belt configuration. I believe that will also go a long way toward curing your overheating problem. BTW: What time is it in Kuwait?
-
On a reverse rotation set-up, the engine rotates clockwise, and the water pump rotates counter-clockwise. If you get an older water pump (1969 ish) and timing chain cover, you can keep your current belt arrangement. Try this: http://www.fordracingparts.com/parts/part_details.asp?PartKeyField=5723
-
You have two options: First, if you want to stay with a serpentine set-up you will need a fourth pulley to act as an idler. A setup like shown here works great and can be purchased as a complete setup. If you want that option visit http://www.marchperf.com. You could visit a junkyard and piece together a workable set-up. This option is time consuming but generally cheaper. The other option is to revert to the early style(1968-1975) water pump and timing chain.
-
In a V-belt system the cross-section of the belt is a V, and all of the accessories (water pump, alternator, power steering pump) rotate the same direction. In a serpentine belt system, the belt is wide and flat. On the Mustang, the water pump is driven off the back of the belt and rotates the opposite direction relative to the crankshaft and alternator. If you look at the following picture (and the one I posted previously) you will see the routing of my serpentine belt. If you have the stock 1989 water pump and V-belts, you will not get good water circulation through any radiator, and the car will run hot. You might be better off spending your money on a serpentine belt system for your car like those offered by March Performance. Your other option is to get a water pump and timing chain cover from an early 302. With that option, you will be able to keep the same pulleys that you have. EDIT: Looking more closely at your picture, it looks like you have serpentine pulleys. It still looks like you are turning the water pump the wrong way.
-
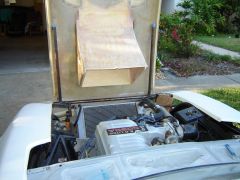
With the engine in the same position as mine, the stock 5.0L belt driven fan works great. Since I've angled my radiator, I've gone to an electric fan from a 1995 mustang. The electric fan works well, but a belt driven fan will always cool better. Looking at your picture, it looks like you dumped the serpentine belt set-up in favor of a v-belt. Did you switch to a forward rotation water pump? If not, that may explain your cooling issue. The late model (1982 -1993) 5.0L engines use a serpentine belt and a reverse rotation water pump. In 1994 and 1995 they kept the reverse rotation and serpentine, but went to a different timing chain cover and water pump that is 1.5" shorter. In my old set-up, I used the 82-93 water pump. I have since switched to the 95 style to gain clearance for my radiator/hood ducting. Oh yeah, the more expensive radiator is rated for cooling more horsepower. If in doubt go with the more expensive one. I am using the lesser of the two with no problems, but I am only making ~320 rwhp.
-
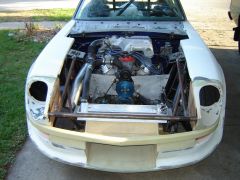
I am using mounts of my own construction. The mounts in the stock sheet metal version used the ford 5.0L rubber motor mounts and some brackets that I made. The new version uses a front plate/mid plate setup. In both versions, the engine is in the same position: Centered left to right. Center of crank shaft even with top of frame rail at front of motor. Harmonic balancer centered above steering rack. Engine angled with front angled upward at 2.5 degrees. Drivers side head is 1" from fire wall.
-
I use the Griffin 24 x 19 in my car with no problems at all, but my car also has a tube front end. I used the same engine combination in the previous version of the same car, and used a 280ZX turbo radiator without problems. I live in Florida where it gets pretty hot (high 90's F) but not nearly as hot as in Kuwait. I never tried to fit the Griffin radiator to the stock radiator core though I believe it will fit with a minimum of fabrication. It is 24" wide and 3" deep. The spacing between the factory frame rails is 25.125".
-

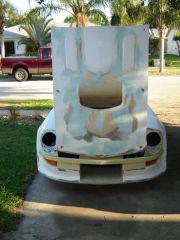
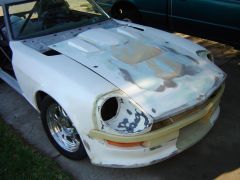
74_5.0L_Z shamelessly emulates Terry Oxendales Hood
74_5.0L_Z replied to 74_5.0L_Z's topic in Body Kits & Paint
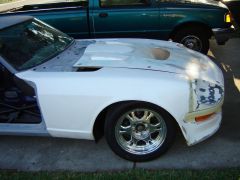
Craved, I am not 100% certain which way air will flow through those vents. They are a little forward of the cowl and outboard of the centerline of the car. They may or may not be in the high pressure area of the windshield base. Somone should do some wind tunnel work to find out. My main concern was to control the air coming through the front of the car. The hood that I started with (SubtleZ Cowl) had two holes like the later 280Z. I could have just filled them in, but I decided that additional vent paths for heat might be a good thing. So, I acquired the two small vent covers from Reaction Research and blended them in. -
-
74_5.0L_Z shamelessly emulates Terry Oxendales Hood
74_5.0L_Z replied to 74_5.0L_Z's topic in Body Kits & Paint
Thanks guys. I will line up the dzus fasteners when I finally secure them to the hood. Yes, those are factory FRP buckets. They are secured to the SubtleZ fenders using epoxy resin w/chopped glass filler (West Systems 406), the factory fasteners, the inner sides have been filleted to the fender using the same resin / glass mixtures, the seam was then ground down and refilled with epoxy/ glass, and finally the seam was covered with epoxy/ S-glass cloth. If it shows after the paint job I will be rather upset, but it would be a lot of work to change then now. -
74_5.0L_Z shamelessly emulates Terry Oxendales Hood
74_5.0L_Z replied to 74_5.0L_Z's topic in Body Kits & Paint
I used a closed cell foam from Michigan Composites. It isn't affected by the resin or other chemicals. I used two different thicknesses 1/4" and 3/8". The 1/4" is easily shaped into curves, and the laminated 3/8" gives good stiffness. The foam is yellowish in color. Yes, I did the SubtleZ rear flares as well. -
-
As the title says, I borrowed an idea from Terry. I hope that my car will someday look as good as his. I still have a bit of work to complete before its ready for paint. I post updates as I go along.
-
-
-
-
-
 Custom hood and air dam
 -
Aerodyn wind tunnel results!!!
74_5.0L_Z replied to bjhines's topic in Windtunnel Test Results and Analysis
Quote: Originally Posted by Daeron could this have been it? This was from 74_5.0L_Z's photo album here on hybridz.. but looking at it a second time, it s hard to see if it prevents that much air from traveling under the car.. obviously his setup forces it through the radiator, but the point is (seems to be?) to avoid it pushing below the car entirely, and leaving the airflow no choice but to go through the engine bay and then out the engine bay vents. I dunno if I am right nor not, but that was the car that *I* was thinking of regarding your comment, there, stony.. What you guys have not seen yet is that all the air that goes through the radiator comes out through the hood (I have shamelessly emulated BlueovalZ's hood). I have also closed in most of the gap between the top of the bumper feature and the bottom lip of the hood. I'll try and take some pictures tomorrow and start a separate thread. I don't want to pollute this one more than necessary. The radiator opening is sealed to the radiator with rubber gasket. The ledge between the bottom of the radiator and the front of the air dam is 18.5" wide by 21" deep. I'm hoping to take advantage of the high pressure area in front of the radiator. -
Aerodyn wind tunnel results!!!
74_5.0L_Z replied to bjhines's topic in Windtunnel Test Results and Analysis
One thing that I am interested in is the position of the center of pressure, and the effect the various modifications have on that position. For high speed stability, it is desirable to have the center of pressure behind the center of mass. -
Aerodyn wind tunnel results!!!
74_5.0L_Z replied to bjhines's topic in Windtunnel Test Results and Analysis
Great job guys!!!!! Did you try out the headlight covers? Do you need any help crunching the data? I am good at that. I am a mechanical engineer, and one of my prime responsibilities is making test data comprehensible. I would love to help. -
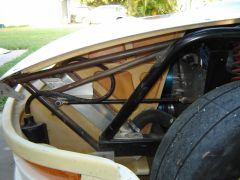
I used a hand held grinder with a 4.5" cut-off wheel and tin snips. The metal that I removed from the firewall forward (not including fenders, hood, crossmember, front apron) weighed 95 lbs. The tubing that replaced it weighed less than 50 lbs. Oh, do yourself a favor: Remove all of the undercoating and sound deadening material before you start. It's easier to do that before you have the car bolted to your fixture. Don't ask me how I know that....
-
"I'm not quite seeing where you are attaching the tube chassis to the structure points of the z!" You'll discover when you cut off the front end that all the metal of the Z is very soft and flimsy. At that point you will not feel very comfortable attaching anything to the firewall as a stuctural element. My solution was this: First, hard mount the car on a surface that gives you a good reference to work from. For me, I built a 2 x 12 wooden structure topped with 1" MDF that just barely fit between the stock frame rails (25.1" wide). This structure extended from the rear (Point C of the factory frame drawing) to past the front. I then aligned the car on this structure and bolted it down. Then I made sure the whole thing was level. From that point on the car did not move relative to the structure. Next, I built frame rails (similar to pparaska's). These were welded to the rear cross member, to the floor pan, and to the firewall. After I had the frame in place, I built the roll bar. It is tied into the rear shock towers and the rear of the rocker panels. From this, I extended door bars forward through the firewall. The door bars then connect to the hoop in front of the firewall. The point where the lower door bar meets the firewall hoop is also welded to the front of the rocker panel, and also meets a bar that angles to the frame above the T/C mount. The point where the upper door bar penetrates the firewall is just below and outboard of the clutch master cylinder. This point is triangulated to the frame and to the strut tower. The bar across the top of the firewall hoop was mainly there to connect the top legs that go to the strut towers. My front end is attched to the car through the framerails, rocker panels, and door bars. However you decide to do yours, spread the load through as much surface area as possible.